See the GRI content index
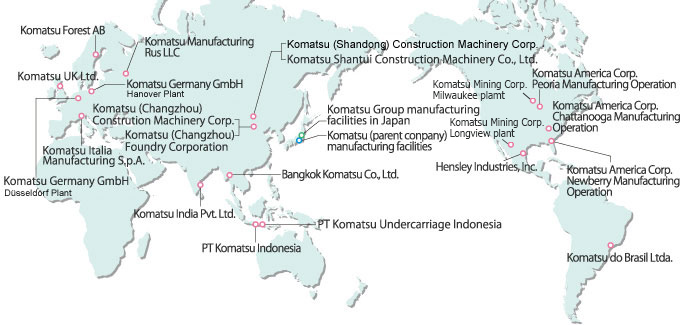
Primarily, this report covers data acquired from April 2022 to the end of March 2023, with a portion of information that involves data acquired after April 2023.
| Classification | Item | Calculation Method | |
|---|---|---|---|
| GHG Energy | Energy | Energy = (fuel, electric energy, etc.) x energy conversion factor
|
|
| GHG | Energy originated CO2 = (fuel quantity, electricity quantity) x CO2 emission factor Non-energy originated GHG = Gas emissions x Global warming potential (GWP)
|
||
| Energy, CO2 emission in basic unit | Basic unit for each plant = (energy, CO2) / (Internal manufacturing value), index is a value with base year 100. Base year: 2010 Total basic unit index = weighted average of the percentage improvement in basic units of each plant from the base year by the energy consumption ratio or the CO2 emissions ratio in the base year. |
||
| Location-based Scope 2 | CO2 emission = purchased electricity quantity x CO2 emission factor
|
||
| Market-based Scope 2 | CO2 emission = purchased electricity quantity x CO2 emission factor
|
||
| Scope3 | C1 | Purchased product service: Product weight x emission factor + cooperating company CO2 emission amounts | |
| C2 | Capital goods: capital investment amount x emission factor | ||
| C3 | Fuels and energy related activities not included in Scope 1 and 2: fuel quantity purchased x emission factor on the upstream side + purchased electric energy amount x upstream side emission factor | ||
| C4 | Transportation, Delivery (upstream): Fuel consumption (amount) x Emission factor (coefficient according to Komatsu actual result survey) | ||
| C5 | Waste from project: Waste volume x Emission factor (coefficient according to Komatsu performance survey) | ||
| C6 | Business trip: travel expenses x emission factor | ||
| C7 | Employer commuting: commuting expenses x emission factor | ||
| C9 | Downstream transport: transport volume x emission factor | ||
| C11 | Use of products sold: Σ (Production volume per product model x Fuel consumption(L/h) x Product life(h) x Emission factor) | ||
| C12 | Disposal of products sold: Product weight x Emission factor | ||
| Emission factor C1, C2, C3, C6, C7, C11, C12: Emission basic unit database (Ver 3.3) for calculating greenhouse gas emissions of organizations through the supply chain of the Ministry of the Environment C3 Fuel: Carbon Footprint Communication Program Basic Database (Ver 1.01) C9: Ministry of Economy, Trade and Industry ・ Ministry of Land, Infrastructure, Transport and Tourism Guidelines for Estimating CO2 Emissions in the Logistics Field |
|||
| CO2 emissions index during product operation | CO2 emissions index estimated based on changes in product fuel consumption reduction, etc. in the aggregate year, with 2010 as the base year and no change in product composition from the base year. | ||
| Exhaust | Sox Emissions | Total for heavy oil, kerosene, light oil and coke: Calculated from fuel quantity x sulfur content in fuel |
|
| NOx Emissions | Total for heavy oil, kerosene, light oil, city gas, and LPG: Calculated from Exhaust gas quantity x NOx concentration |
||
| Drainage | BOD Emissions | Calculated from Wastewater x BOD Average Concentration Measurement Value | |
| COD Emissions | Calculated from Wastewater x COD average concentration measured value | ||
| Water | Amount of water used | Total amount of water intake, including clean water, industrial water and groundwater | |
| Intensity of water input | Intensity at a plant = (amount of water used) / (internal manufacturing value); the base year of the index is 100. Base year: 2010 Total basic unit index = weighted average of percentage improvement in basic units of each plant from the base year by the ratio of water input in the base year. |
||
| Waste | Amount of waste | Total amount of waste excluding valuables | |
| Waste intensity | Intensity at a plant = (amount of waste) / (internal manufacturing value); the base year of the index is 100. Base year: 2010 Total basic unit index = weighted average of percentage improvement in basic units of each plant from the base year by the ratio of waste amount in the base year. |
||
| PRTR materials | Amount of these materials emitted or moved | Multiply the number of secondary materials used by the content of specified chemical substances and the rate of emissions and movement in accordance with the Act on Confirmation, etc. of Release Amounts of Specific Chemical Substances in the Environment and Promotion of Improvements to the Management Thereof (PRTR Act). | |
The coverage rate of main data and ISO 14001 was calculated using the number of people as an index.