Independent Practitioner's Assurance
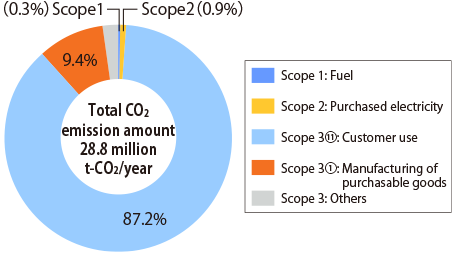
| Category | Rate (%) | Summary Data thousand t-CO2 |
|---|---|---|
| Scope3 (1)Manufacturing of Purchasable Goods | 9.5 | 2,703 |
| Scope3 (2)Capital Goods Construction and others | 0.7 | 206 |
| Scope3 (3)Fuel Procurement | 0.4 | 116 |
| Scope3 (4)Upstream Transportation disposal | 0.4 | 102 |
| Scope3 (5)Waste Transportation | 0.0 | 13 |
| Scope3 (6)Business Trips | 0.5 | 147 |
| Scope3 (7)Commuting | 0.2 | 47 |
| Scope3 (8)Upstream Leased Assets Operation | - | - |
| Scope3 (9)Downstream Transportation | - | - |
| Scope3 (10)Processing Sold Products | - | - |
| Scope3 (11)Customer Use | 88.3 | 25,160 |
| Scope3 (12)Product disposal | 0.1 | 16 |
| Scope3 (13)Downstream Leased Assets Operation | - | - |
| Scope3 (14)Franchise Member Companies | - | - |
| Scope3 (15)Investment Management | - | - |
| Total CO2Emission Amount (thousand t-CO2/year) | 100.0 | 28,509 |
Reference: Pie chart for Scope 1, 2, and 3 Independent Practitioner's Assurance